Monitoring
Overview
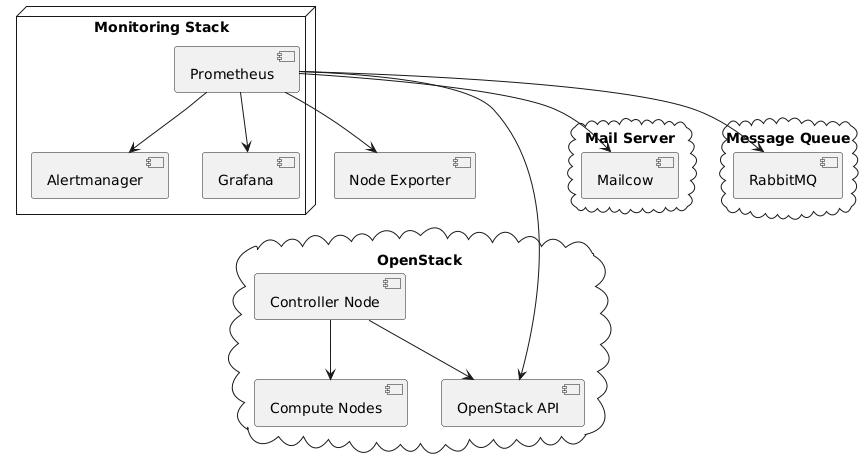
Monitoring in our infrastructure ensures that all services (OpenStack, Mailcow, RabbitMQ, Kubernetes clusters, and VPS instances) are continuously observed for health, performance, and availability. We use Prometheus for metrics collection and Grafana for visualization, combined with alerting mechanisms to notify the operations team about issues in real-time.
This setup supports both multi-tenant and single-tenant monitoring, allowing us to isolate metrics by project or user when necessary.
Monitoring Stack
| Component | Purpose |
|---|---|
| Prometheus | Scrapes and stores metrics from infrastructure, OpenStack APIs, Mailcow API, and services. |
| Grafana | Provides interactive dashboards for visualizing metrics and trends. |
| Alertmanager | Sends alerts (Email, Slack, etc.) when thresholds are breached. |
| Node Exporter | Runs on each server/VM to provide hardware and OS-level metrics. |
| Blackbox Exporter | Probes endpoints for uptime and availability monitoring. |
| OpenStack Telemetry (Ceilometer/Gnocchi) | Exposes OpenStack-specific metrics like instance CPU usage, network I/O. |
Metrics Collected
We collect several categories of metrics:
-
Infrastructure Metrics
- CPU, memory, disk usage
- Network bandwidth and packet errors
- Disk I/O latency and throughput
-
OpenStack Metrics
- API response times
- Instance state changes
- Storage volumes status
- Floating IP assignments
-
Mailcow Metrics
- Mail queue size
- SMTP response times
- Spam detection rates
- Mailbox quota usage
-
RabbitMQ Metrics
- Queue length
- Message publish and consume rates
- Consumer health
Alerting
Alerting rules are defined in Prometheus Alertmanager:
-
Critical Alerts (Immediate action required)
- OpenStack service down
- RabbitMQ queue overload
- Mailcow SMTP failure
- Node down
-
Warning Alerts
- High CPU usage (> 80%)
- Disk usage over 85%
- Memory usage over 90%
- Network packet loss > 5%
Multi-Tenant Metrics Isolation
Prometheus scraping targets are organized by labels representing the tenant or project. This allows:
- Per-tenant dashboards in Grafana
- Tenant-specific alerting
- Simplified billing and SLA compliance
Monitoring Architecture Diagram